
Page 145 - Crisil Annual Report 2023
P. 145
Sustainability
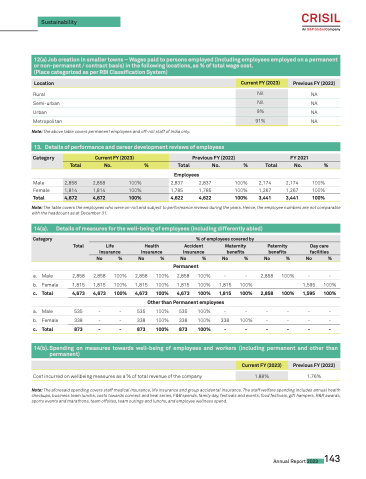
12(a) Job creation in smaller towns – Wages paid to persons employed (including employees employed on a permanent or non-permanent / contract basis) in the following locations, as % of total wage cost.
(Place categorized as per RBI Classification System)
Location
Rural Semi-urban Urban Metropolitan
Note: The above table covers permanent employees and off-roll staff of India only.
NA NA NA NA
2,174 100%
1,267 100%
3,441 100%
13. Details of performance and career development reviews of employees
Category
Current FY (2023)
Previous FY (2022)
FY2021
Total
No.
%
Total
No.
%
Total
No.
%
2,858
2,858
100%
1,814
1,814
100%
4,672
4,672
100%
Male Female Total
Employees
2,837 2,837
1,785 1,785
4,622 4,622
100%
100%
100%
2,174
1,267
3,441
Note: The table covers the employees who were on-roll and subject to performance reviews during the years. Hence, the employee numbers are not comparable with the headcount as at December 31.
14(a). Details of measures for the well-being of employees (including differently abled)
Permanent
Category
% of employees covered by
Total
Life Insurance
Health Insurance
Accident Insurance
Maternity benefits
Paternity benefits
Day care facilities
No
%
No
%
No
%
No
%
No
%
No
%
a. Male 2,858 2,858 100% 2,858 100% 2,858
b. Female 1,815 1,815 100% 1,815 100% 1,815
100% - - 2,858 100% - -
100% 1,815 100% 1,595 100%
100% 1,815 100% 2,858 100% 1,595 100%
c. Total
a.Male
b.Female
c.Total
4,673 4,673 100% 4,673 100% 4,673
Nil
Nil
9%
91%
535 - -
338 - -
873 - -
Other than Permanent employees
535 100% 535 100% - - - -
338 100% 338 100% 338 100% - -
873 100% 873 100% - - - -
- -
- -
- -
1.76%
14(b).Spending on measures towards well-being of employees and workers (including permanent and other than permanent)
Cost incurred on wellbeing measures as a % of total revenue of the company
Current FY (2023)
Current FY (2023)
Previous FY (2022)
Previous FY (2022)
1.88%
Note: The aforesaid spending covers staff medical insurance, life insurance and group accidental insurance. The staff welfare spending includes annual health checkups, business team lunchs, costs towards connect and heal series, F&B spends, family day, festivals and events, food festivals, gift hampers, R&R awards, sports events and marathons, team offsites, team outings and lunchs, and employee wellness spend.
Annual Report 2023 143
